Market value in time

Every property has its own development of the market value

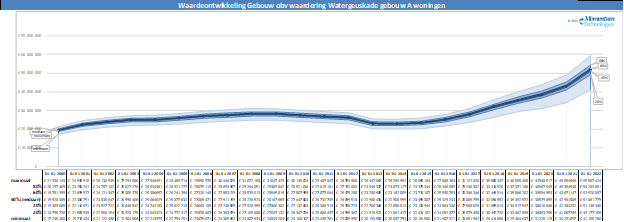
The market value of a house is determined by comparing it with reference sales and applies to a specific date, the valuation date. Using sales of comparable houses in the past, it is possible to establish its market value for dates in the past. This leads to the specific development of the market value of the property at hand.

The graph above shows the market value and reliability of the valuation using bandwidths for each valuation date. For each valuation date, the probability distribution of the value is, as it were, viewed from above.

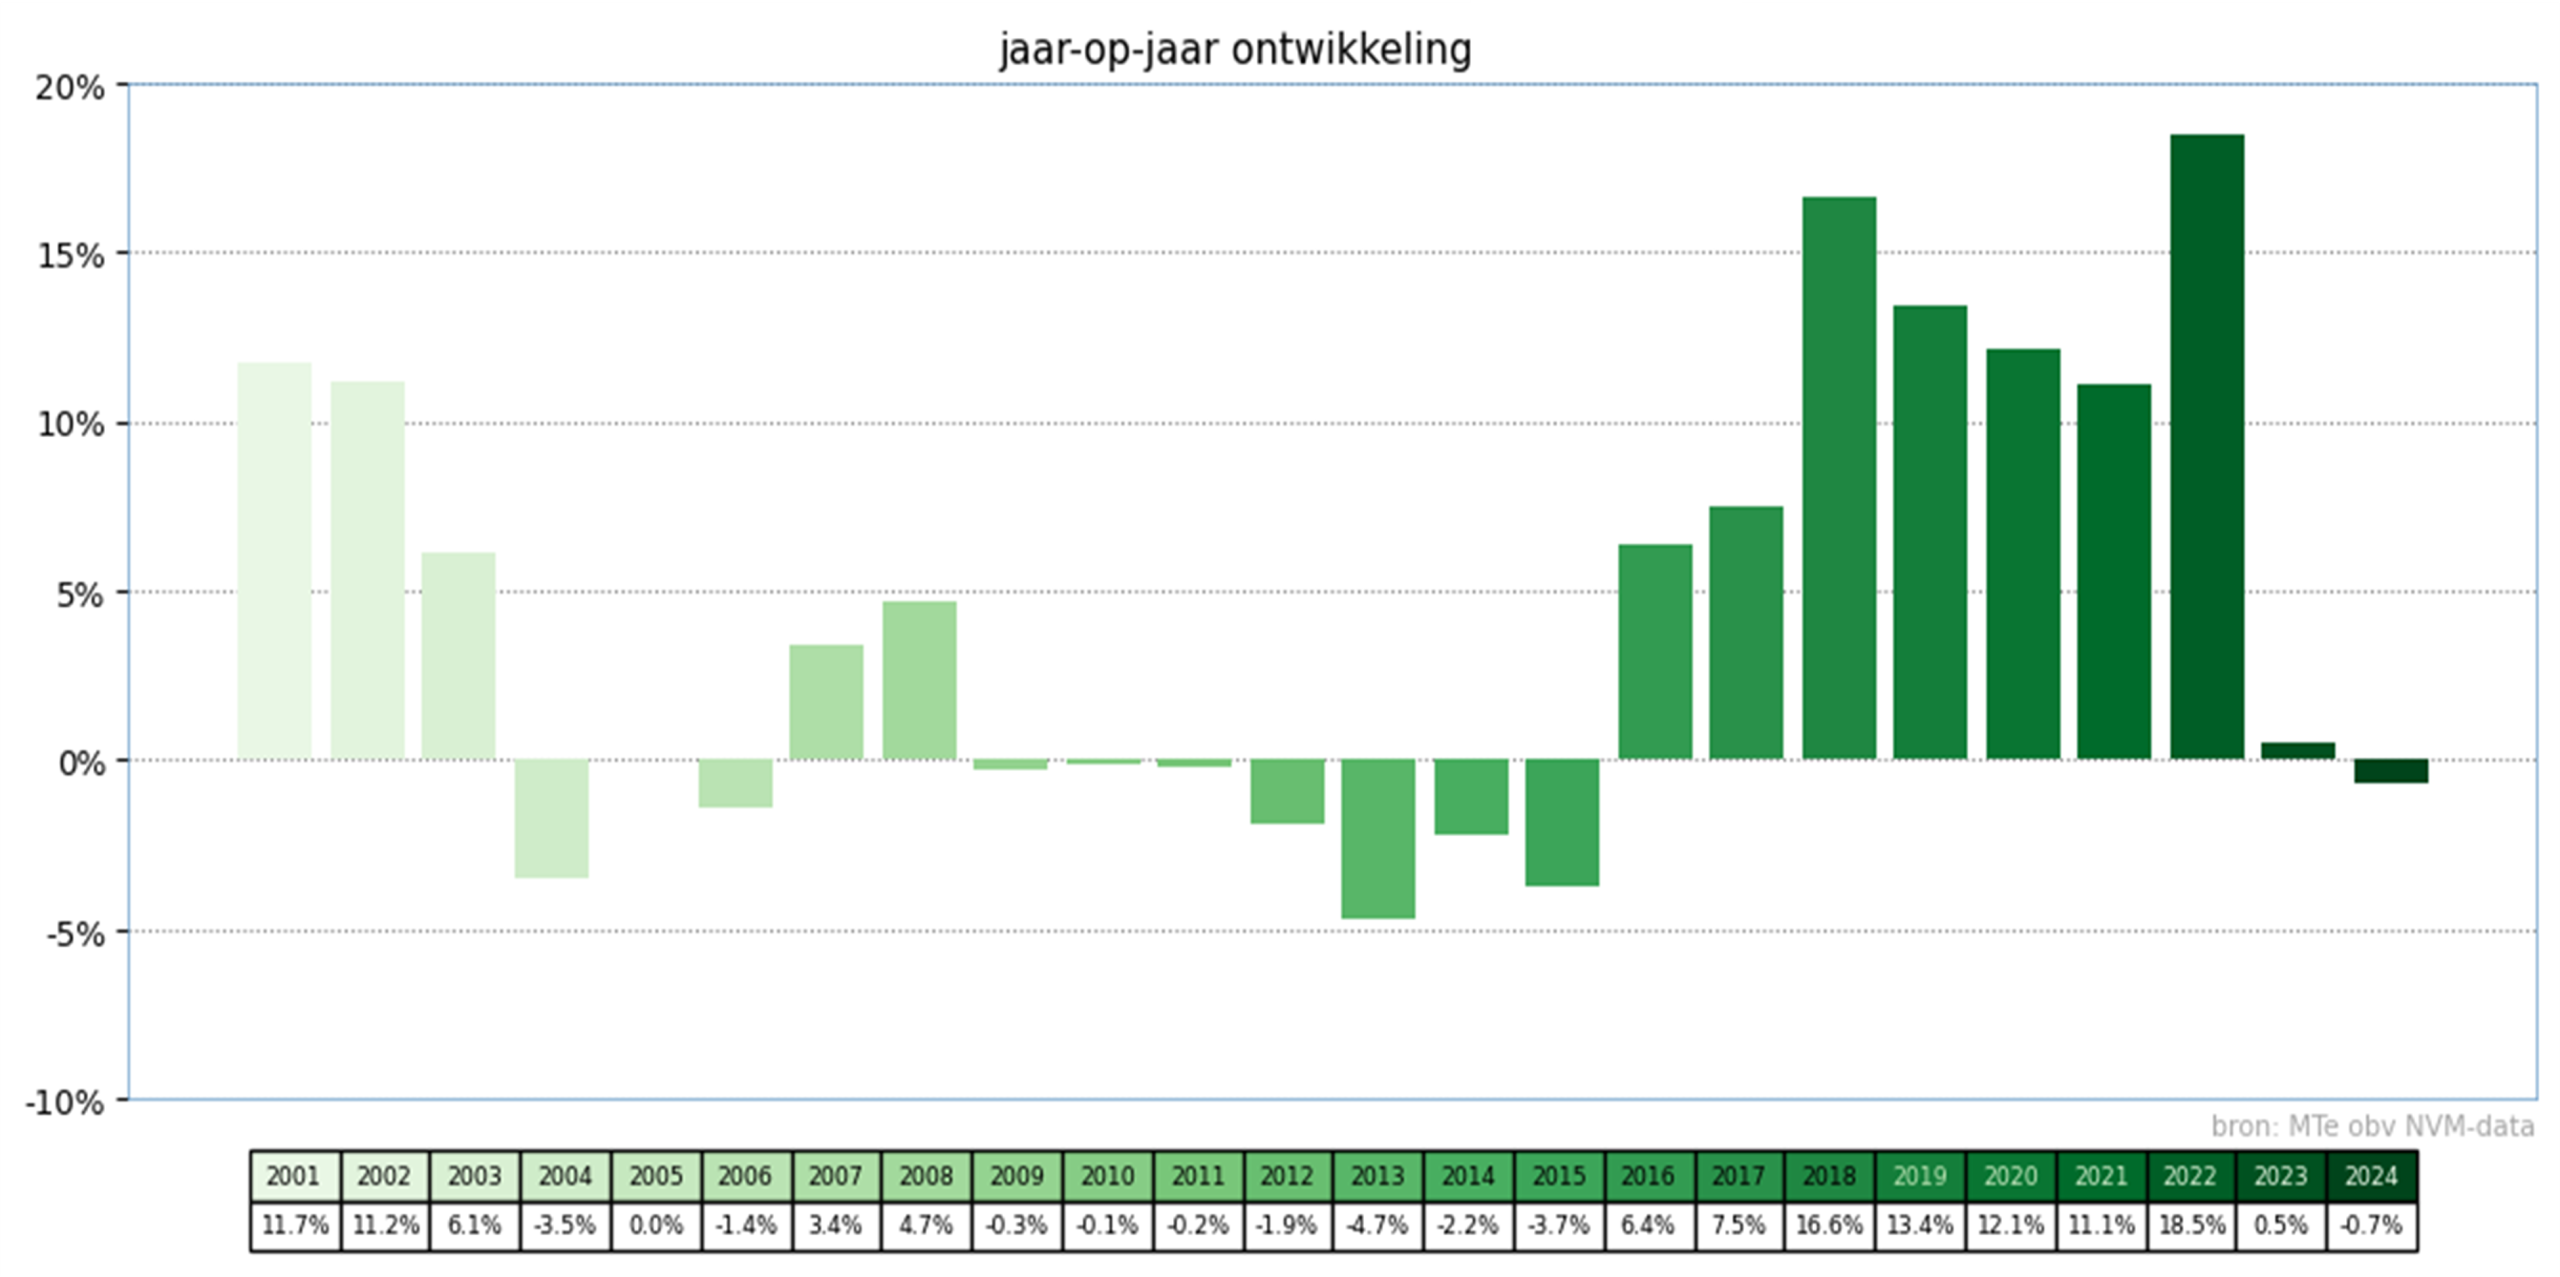
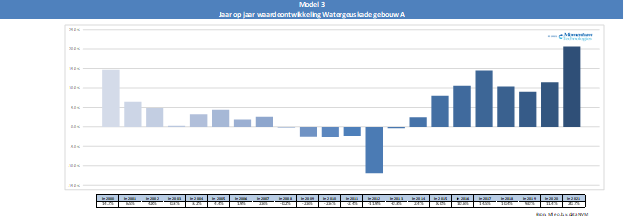
When we focus on the development of the median market value, the percentage year-on-year development becomes clear.

Mortgage risk


In general, risk means that there is a chance of an unfavorable event occurring or the danger that something will go wrong. If you want to express a particular risk in euros, the formula is as follows:

Risk=Chance×Damage

The risk associated with a mortgage loan depends, among other things, on the borrower’s creditworthiness and the financing conditions, but also on the likelihood that the collateral will yield less than the mortgage when sold.

Value of the collateral relative to the mortgage loan

To determine the risk that the collateral will yield too little upon sale, the probability distribution of its value is necessary. Only in this way can the probability be determined that the value will be lower than the mortgage.

For example: The value of a home is €200,000 and has a probability distribution with a standard deviation of 7.5%. The mortgage is equal to €180,000.

The probability that the value will be lower than the mortgage is equal to the sum of all blue bars to the left of the red line, which amounts to 7.8%.

The probability that the house will be sold for, say, €175,000 is equal to the length of the corresponding bar, approximately 0.016%.

In that case, the loss would be equal to €175,000 – €180,000 = €5,000.

The risk associated with a sale price of €175,000 is equal to €80 (0.016 x €5,000).

The probability that the sale price will fall below the amount of the mortgage can be determined by performing this calculation for all bars to the left of the red line and adding up the results. This leads to €8,075.

Importance of a good valuation

The certainty of the valuation is reflected in the probability distribution of the value. The narrower the distribution, the higher the bars around the average and the more certain the valuation. (The standard deviation is used as a measure for this).

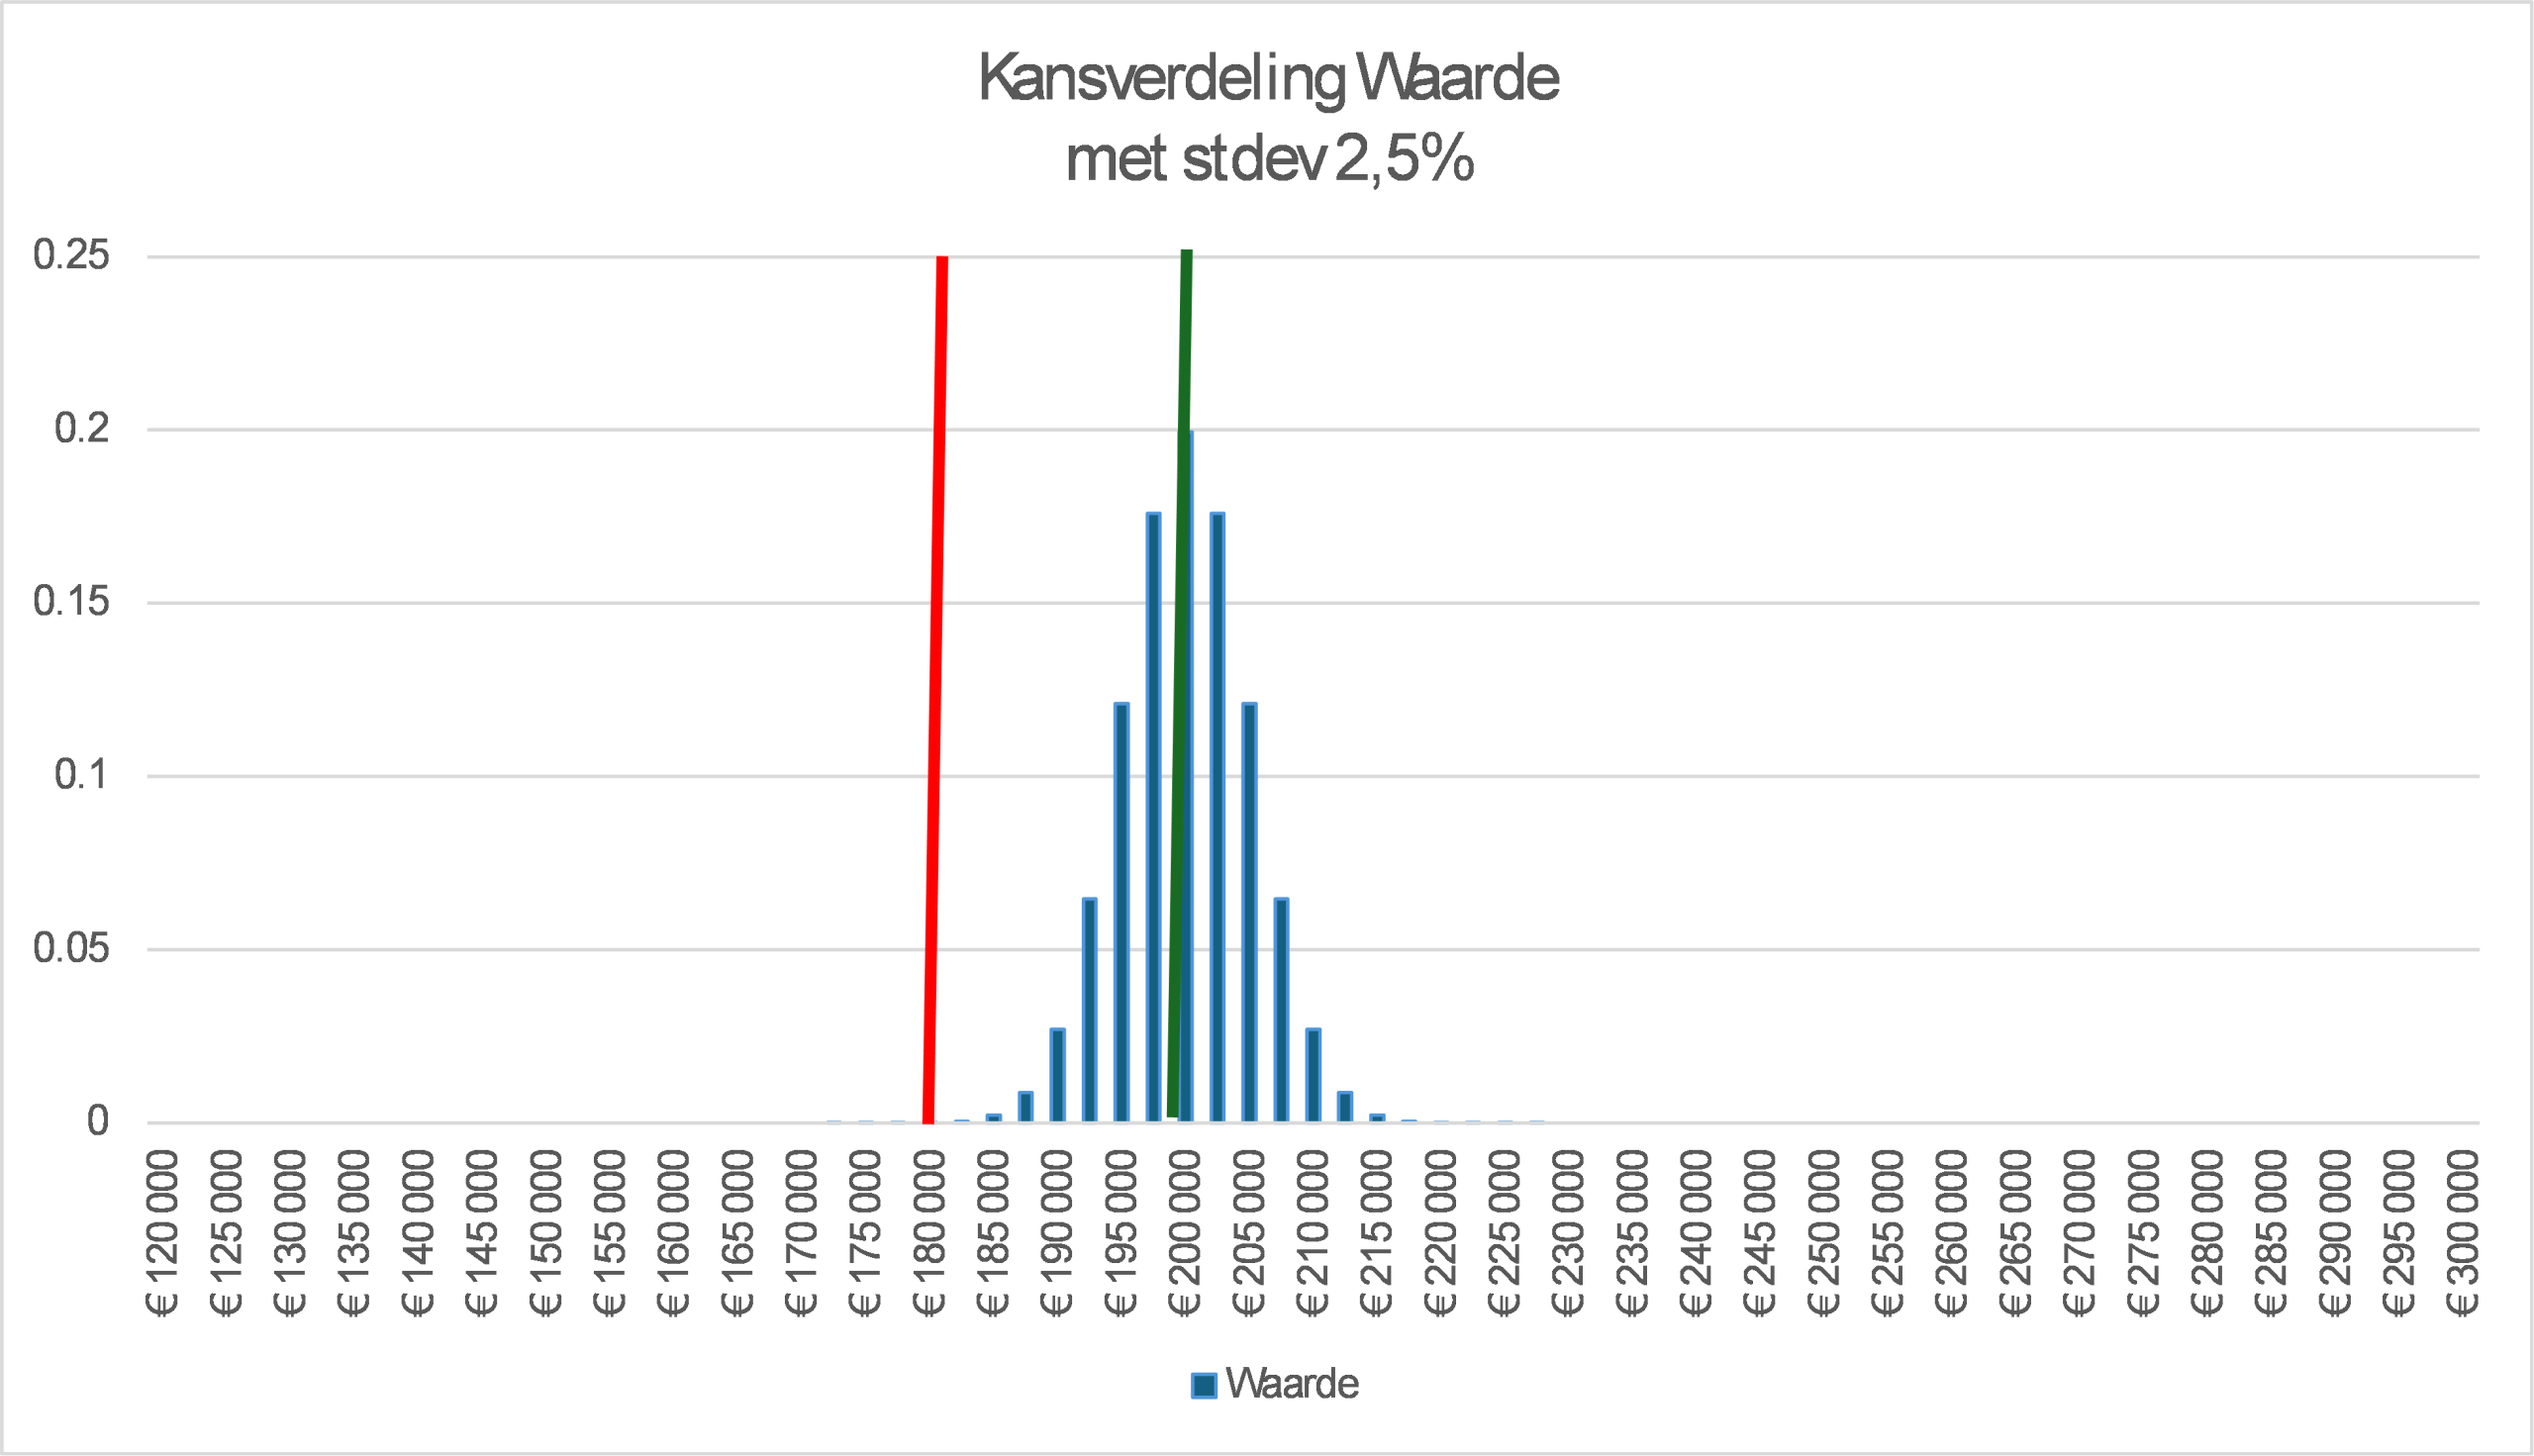
For example, if the standard deviation were equal to 2.5%, the graph would look like this:

And the risk that the sale price would fall below the mortgage amount would be equal to €0.

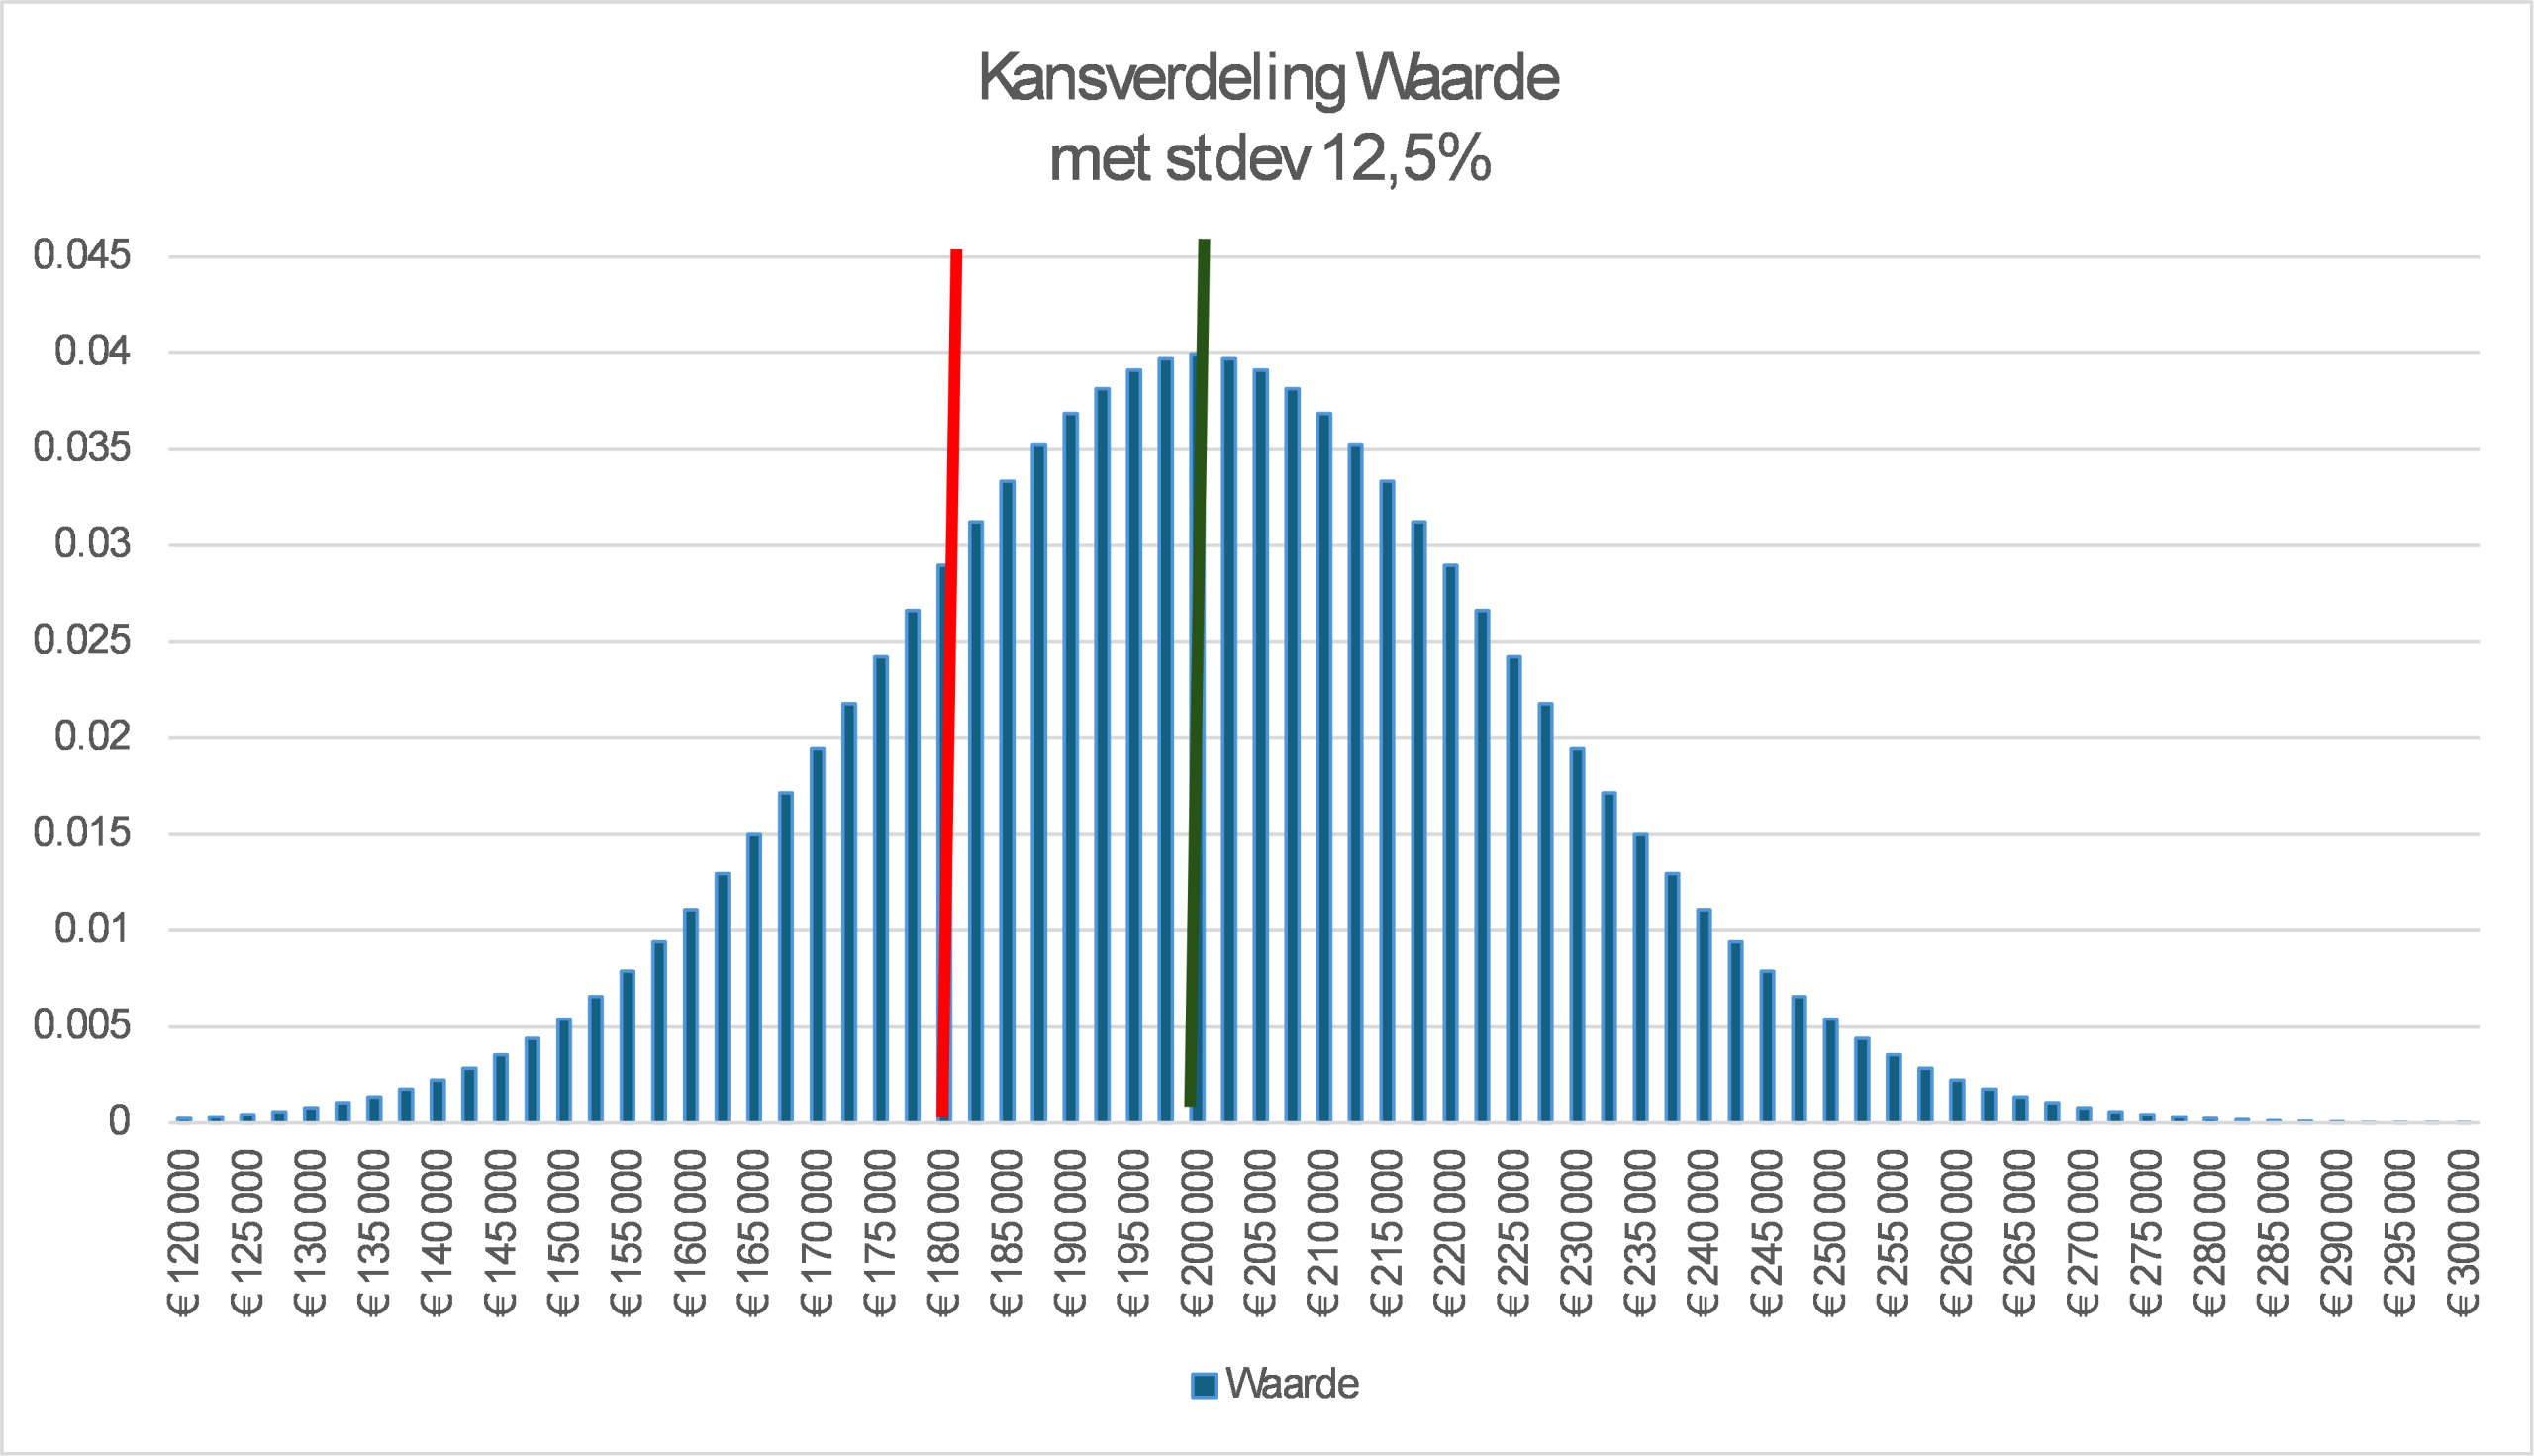
If the standard deviation were equal to 12.5%, the graph would look as follows:

And the risk of the sale price falling below the mortgage amount would be equal to €15,027.

Risk of poor foundation


Foundation problems are receiving increasing attention. According to the Rli (Council for the Evironment and Infrastructure), there are around 425,000 homes in the Netherlands with expected moderate or very serious foundation damage.

But what is the risk of foundation damage for an individual home?

Risks in the future

In general, the following applies:

Risk=Chance×Damage

This means that both the probability of a certain type of foundation damage and the associated costs must be known to calculate the risk.
However, the damage will only become apparent sometime in the future. This means that depreciation, or the devaluation of money, must be considered. After all, a euro in the future is worth less than a euro today.
The depreciation of money can be calculated using the Net Present Value Method. This method uses a discount rate, which indicates how much the required money could have yielded if it had been used differently. For example, in an investment account.

An example

Suppose a house is purchased for €450,000, with a 30-year mortgage. And the house has three risks of foundation damage that are not reflected in the price:

  • Minor problems
    On average, once every two years, €2,000 in costs for:
    • Small cracks in stucco or paint
    • Hairline cracks in walls or ceilings
  • Medium problems
    Average cost of €10,000 once every 4 years for:
    • Wide cracks in masonry
    • Sagging floors (warping)
    • Warping of window frames and doors
    • Problems with pipes or drains because of shifting
  • Major problems
    On average once every 25 years € 40,000 in costs for:
    • Large cracks in load-bearing walls
    • Instability of floors and supporting structures

The annual risk of minor problems is €1,000 (= 50% x €2,000). The annual risk of medium-sized problems is €2,500 (= 25% x €10,000) and the annual risk of major problems is €1,600 (= 4% x €40,000).

If the depreciation of money were not taken into account, the risk for the next 30 years would be €153,000. €30,000 for minor problems, €75,000 for medium-sized problems, and €48,000 for major problems.
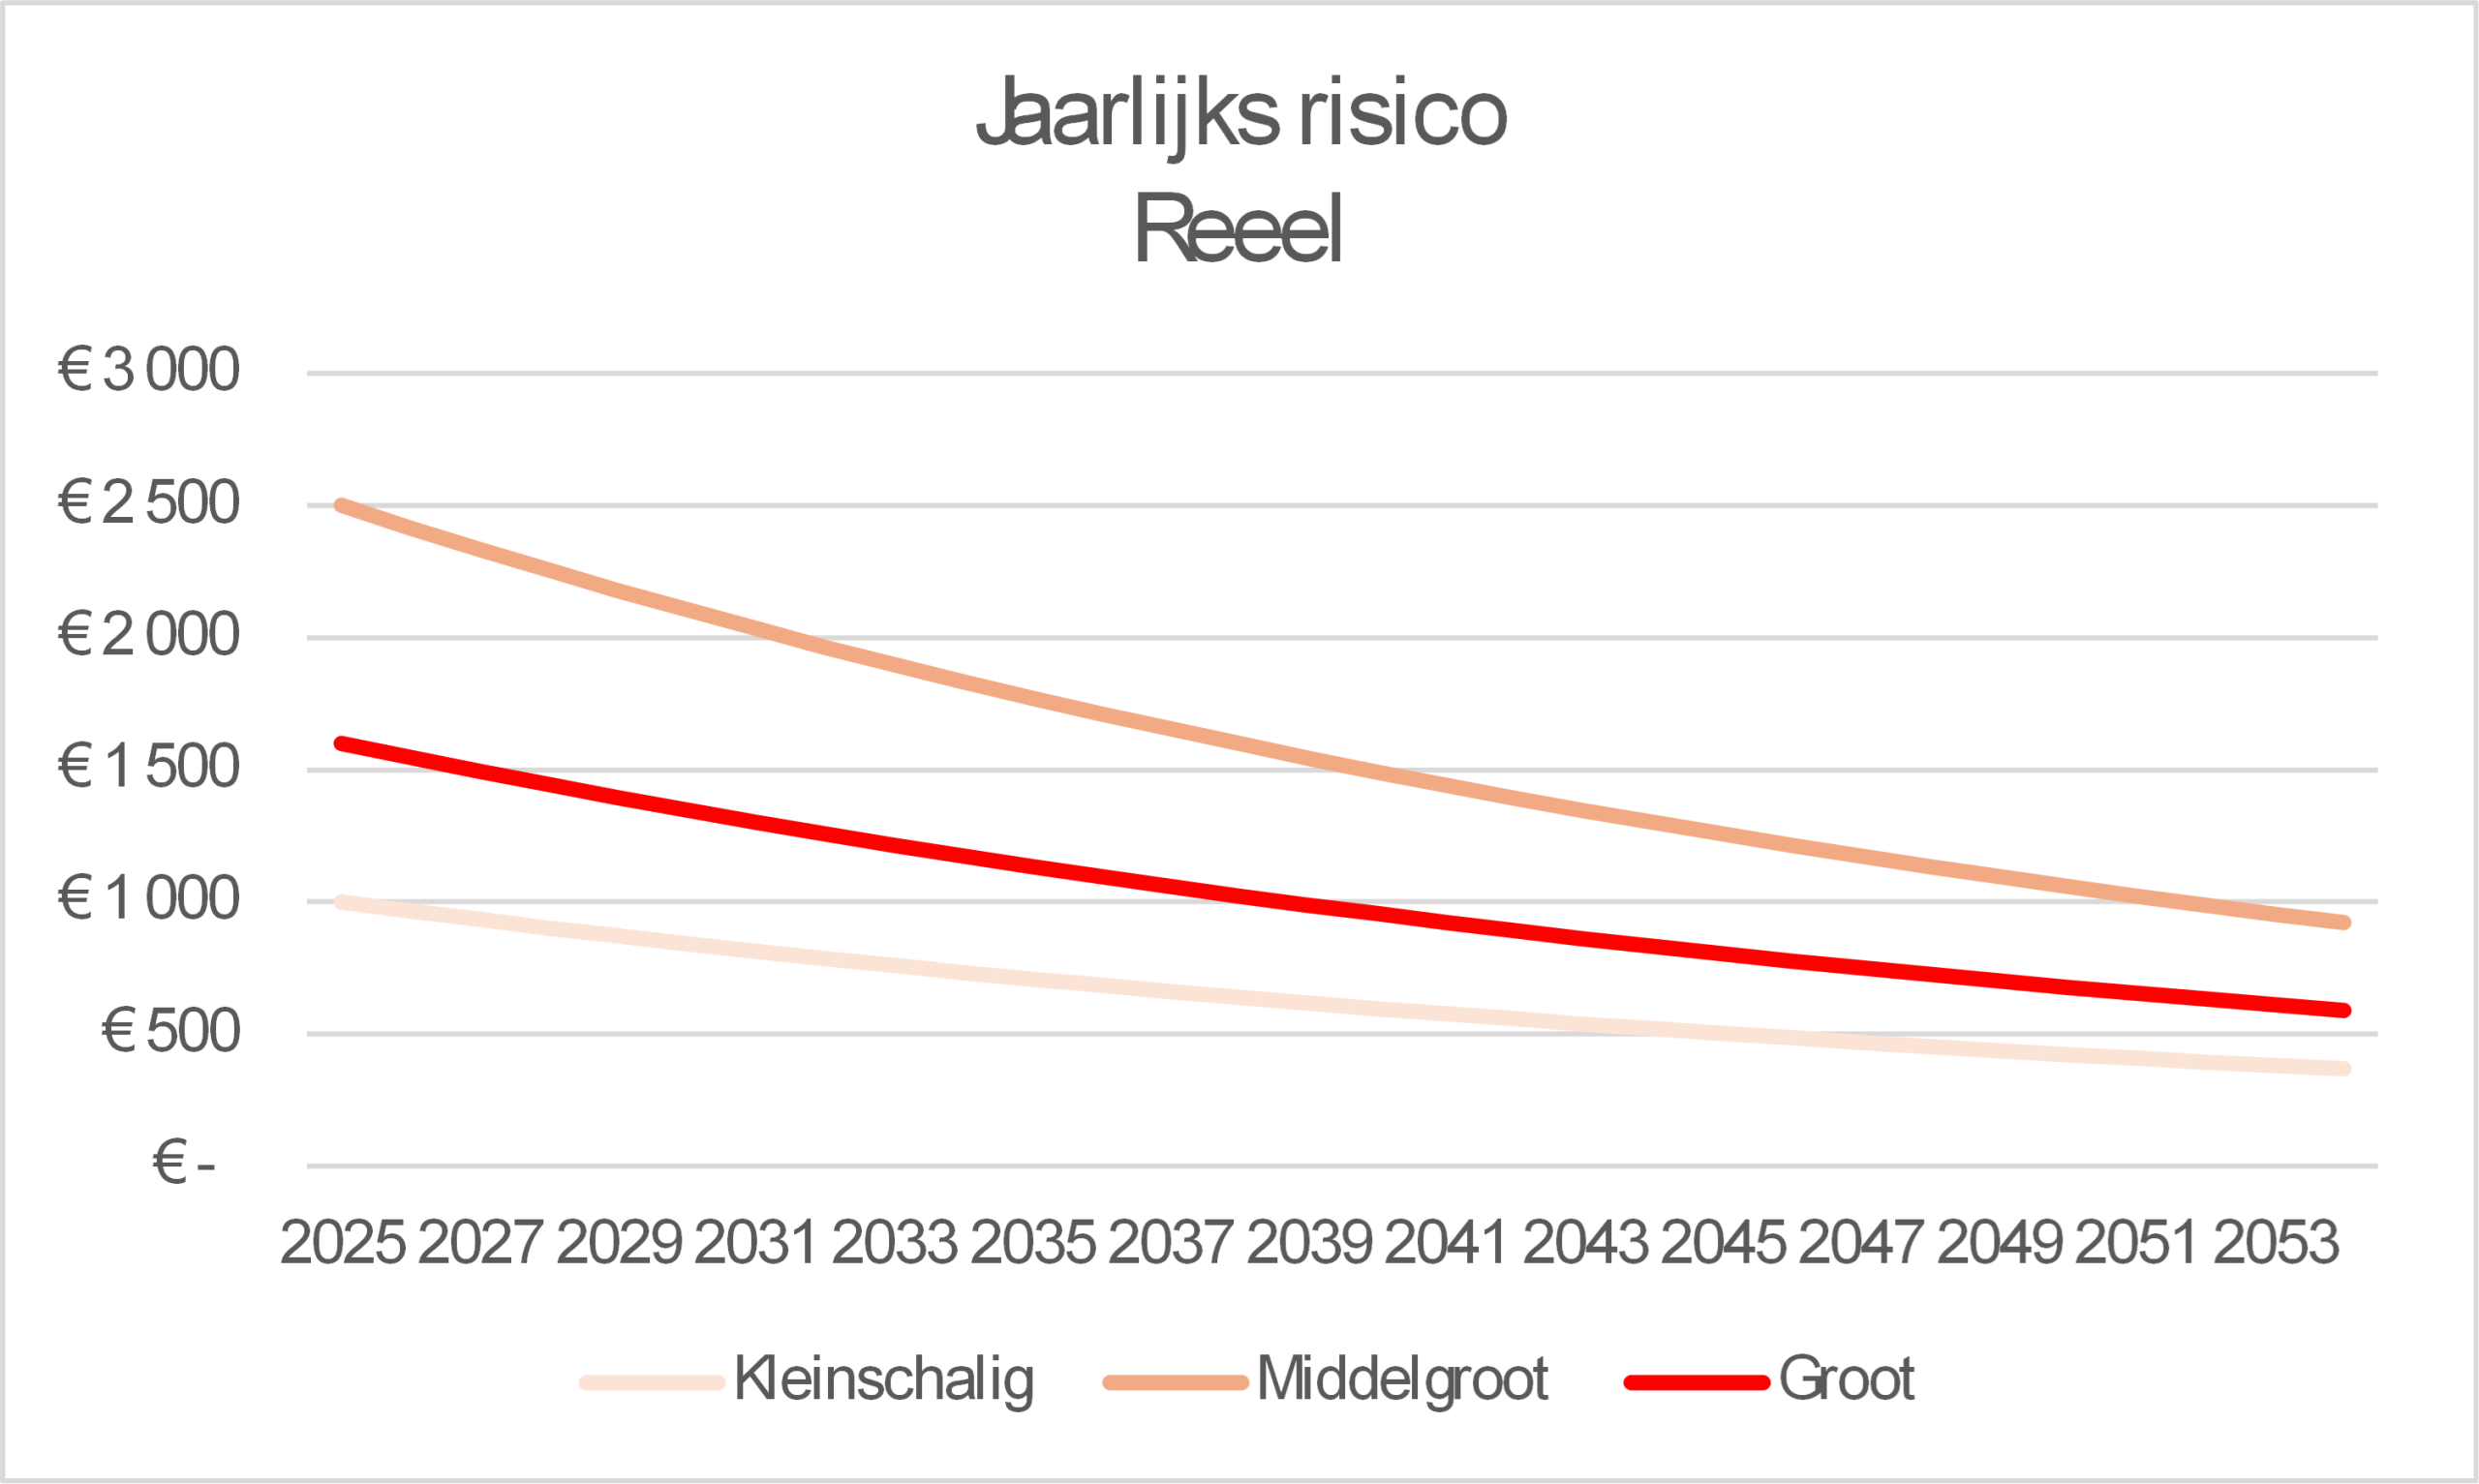
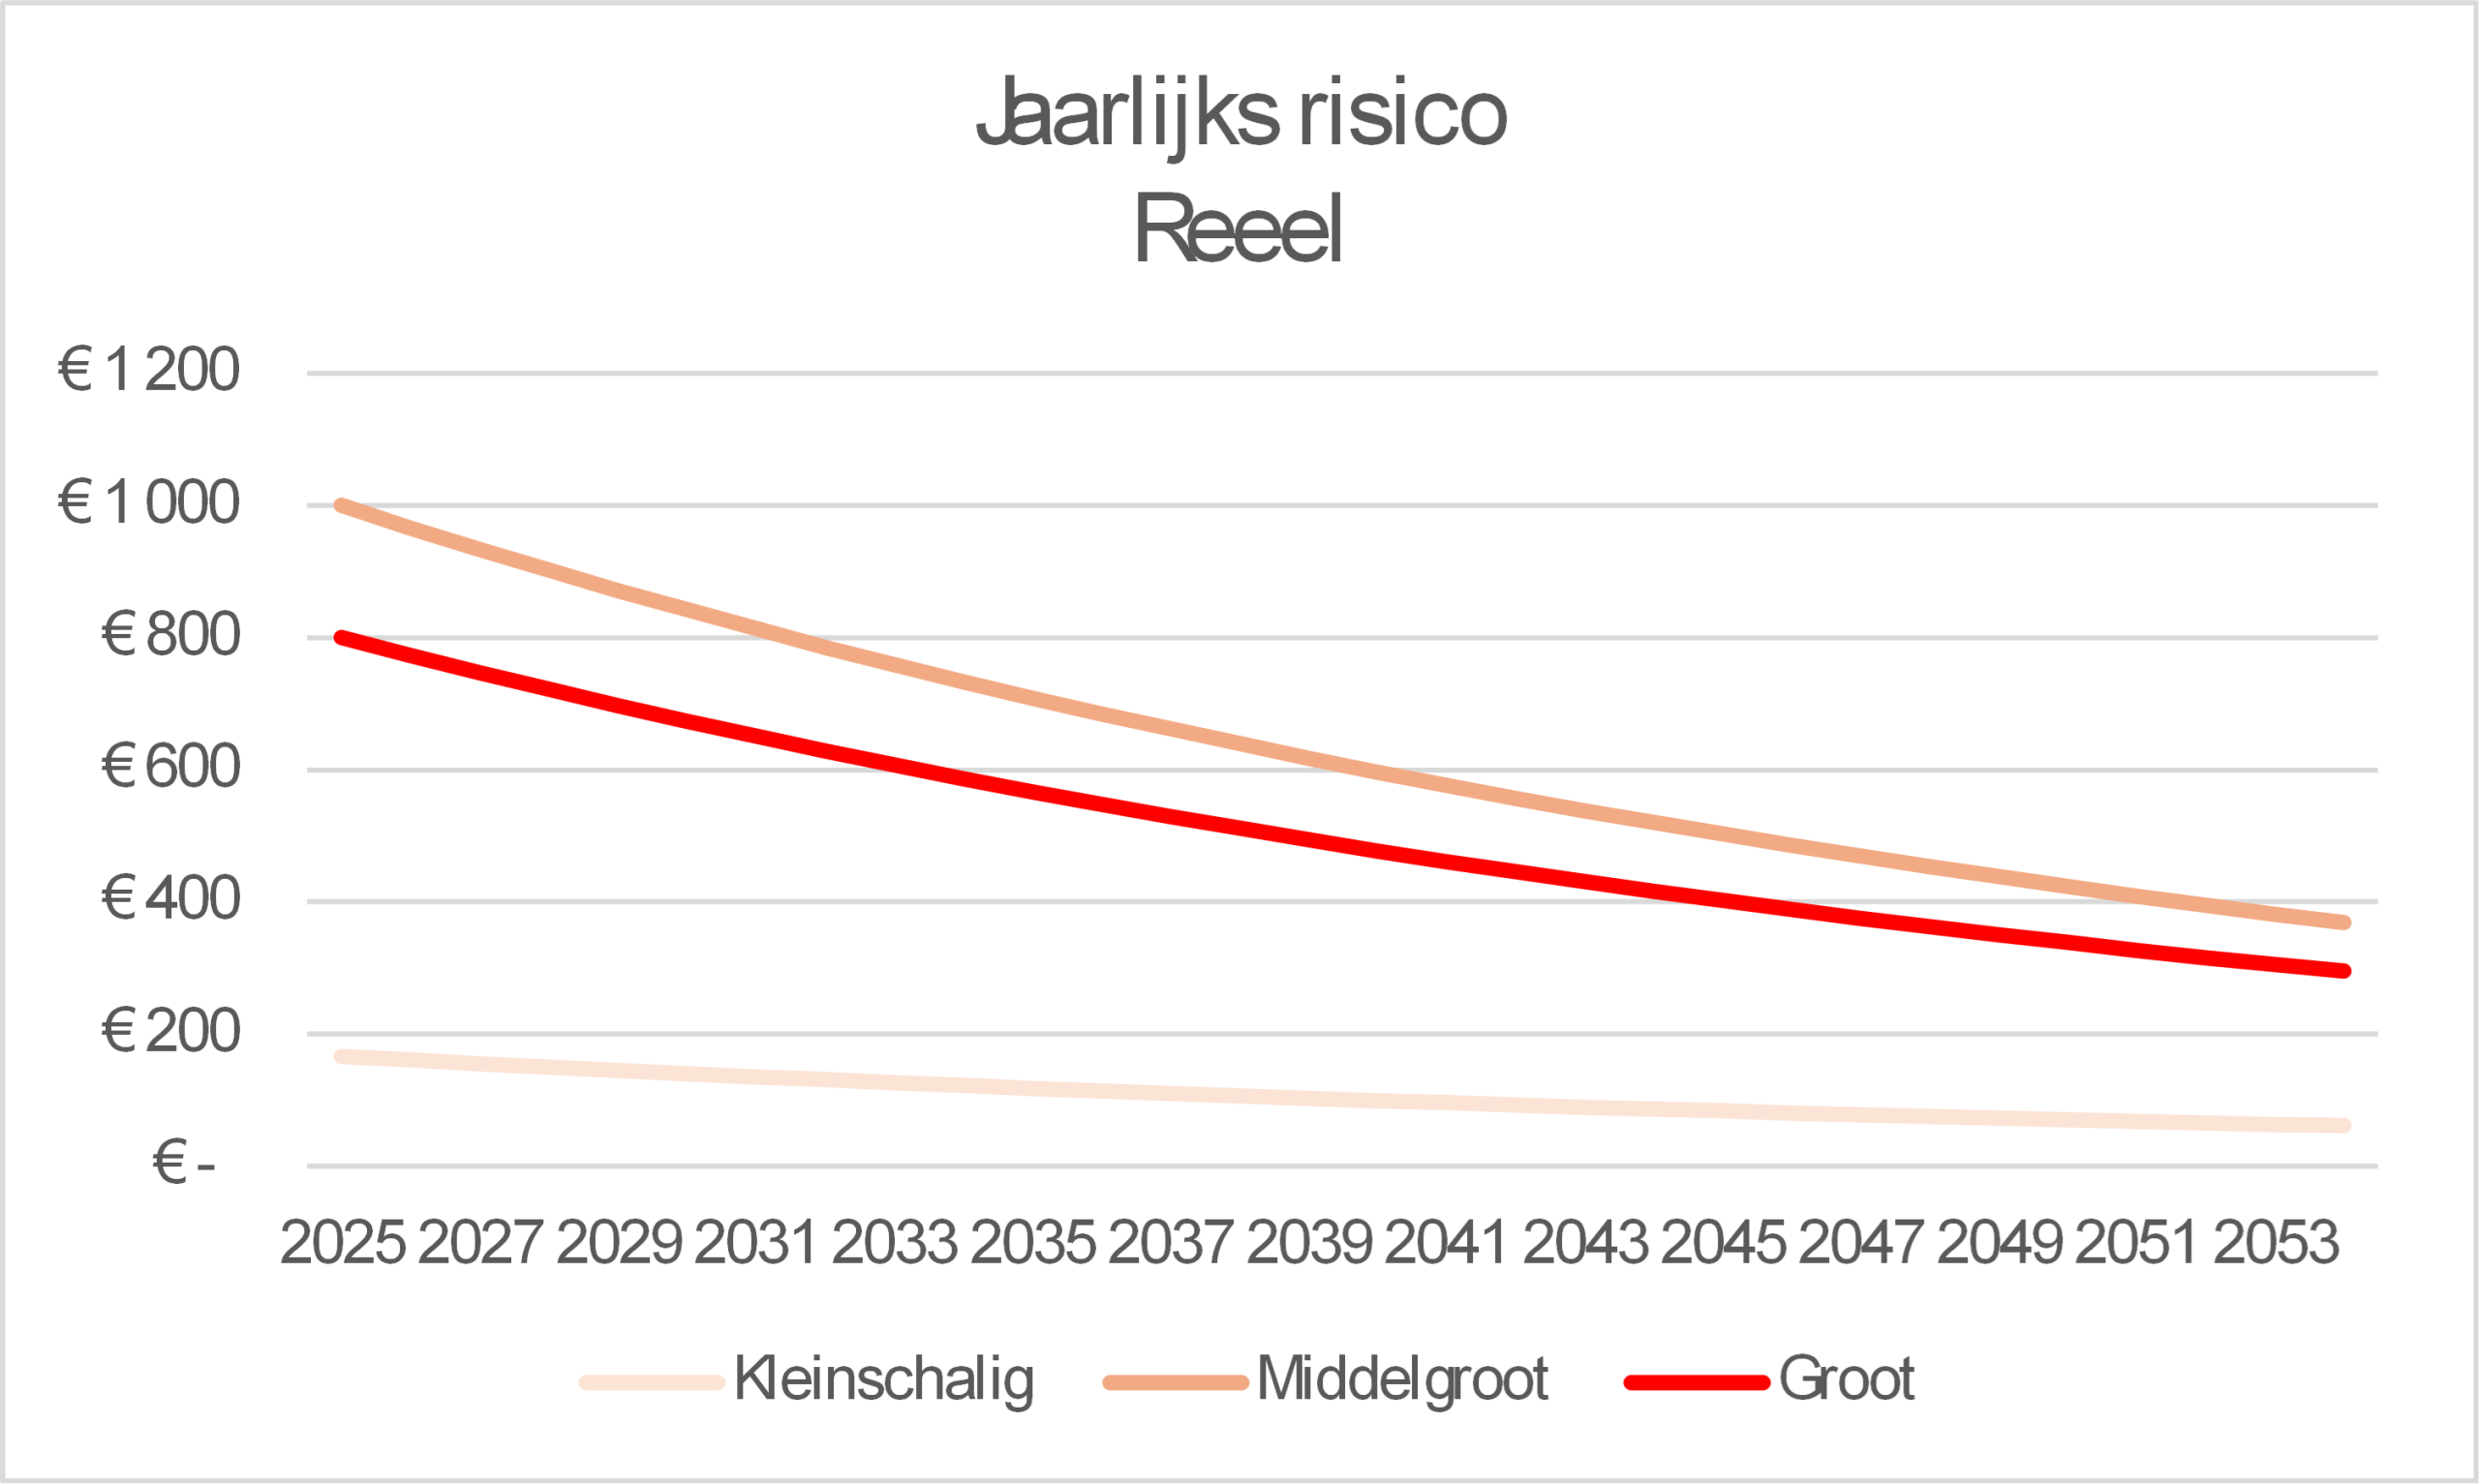
Taking into account a discount rate of 3.5%, the annual risks are as follows:

The total risk is then equal to €97,082.

Risk of flooding


Climate change is receiving increasing attention. In the Netherlands, homes are at risk from flooding as a result of heavy rainfall.

But what is the risk for an individual residential property in a flood zone when purchasing?

Risks in the future

Risk=Chance×Damage

This means that both the probability of a certain type of damage and the associated costs must be known to calculate the risk.
However, the damage will only become apparent sometime in the future. This means that depreciation, or the devaluation of money, must be taken into account. After all, a euro in the future is worth less than a euro today.
The depreciation of money can be calculated using the Net Present Value Method. This method uses a discount rate, which indicates how much the required money could have yielded if it had been used differently. For example, by opening an investment account.

An example

Suppose a residential property is purchased for €450,000, with a 30-year mortgage. The property has three risks of water damage that are not reflected in the price:

  • Minor problems
    Average cost of €500 once every three years for:
    • Moisture spots and mud residue on walls and floors
    • Damaged stucco and paint due to brief immersion
  • Medium problems
    On average, once every 5 years, €5,000 in costs for:
    • Moisture in floors and walls leading to warping of laminate or parquet flooring
    • Windows and doors that close poorly due to slight deformation
    • Minor electrical faults (sockets, switches)
  • Major problems
    On average once every 25 years €20,000 in costs for:
    • Wide cracks in masonry due to saturation of the substrate
    • Damaged wooden beams and window frames due to prolonged immersion
    • Electrical installations and pipes that need to be completely replaced

The annual risk for minor problems is €167 (= 33.33% x €500). The annual risk for medium-sized problems is €1,000 (= 20% x €5,000) and the annual risk for major problems is €800 (= 4% x €20,000).

If the depreciation of money were not taken into account, the risk for the next 30 years would be €59,000: €5,000 for minor problems, €30,000 for medium-sized problems, and €24,000 for major problems.
Taking into account a discount rate of 3.5%, the annual risks are as follows:

The total risk is then equal to €37,437.
Climate change is leading to more extreme weather, increasing the likelihood of more serious problems causing much greater damage, including the total loss of a home. By accurately assessing the increasing likelihood of total loss, the risk can be estimated.

From supply to sales

Insight into the development of supply and sales

To understand the housing market, insight into the development of supply and sales is essential.

For a given period, there were already homes available at a certain price at the start of the period (“old” supply) and during this period, supply at a certain price was added (“new” supply).

Both types of supply are sold during the period, which makes it possible to track the development of demand and transaction prices.

The ”model of a pond” provides insight into the following information per area, per period, and per housing type.

A transparent valuation

Every valuation of a specific property made transparent

A clear picture of the reliability

A property valuation is essentially an estimate of the market value on a specific date. Like any estimate, a valuation has a margin of error, which reflects the certainty of the estimate. The smaller the margin of error, the more certain the estimate.

Momentum Technologies provides for each valuation its probability distribution. The probability distribution indicates for possible ranges how certain it is that the value falls within these ranges.

Comparable sales data used

The certainty of a valuation is closely related to the quality of the comparable sales used, also known as reference sales. The more similar the properties used as reference sales are to the property being valued, the more certain the valuation will be.

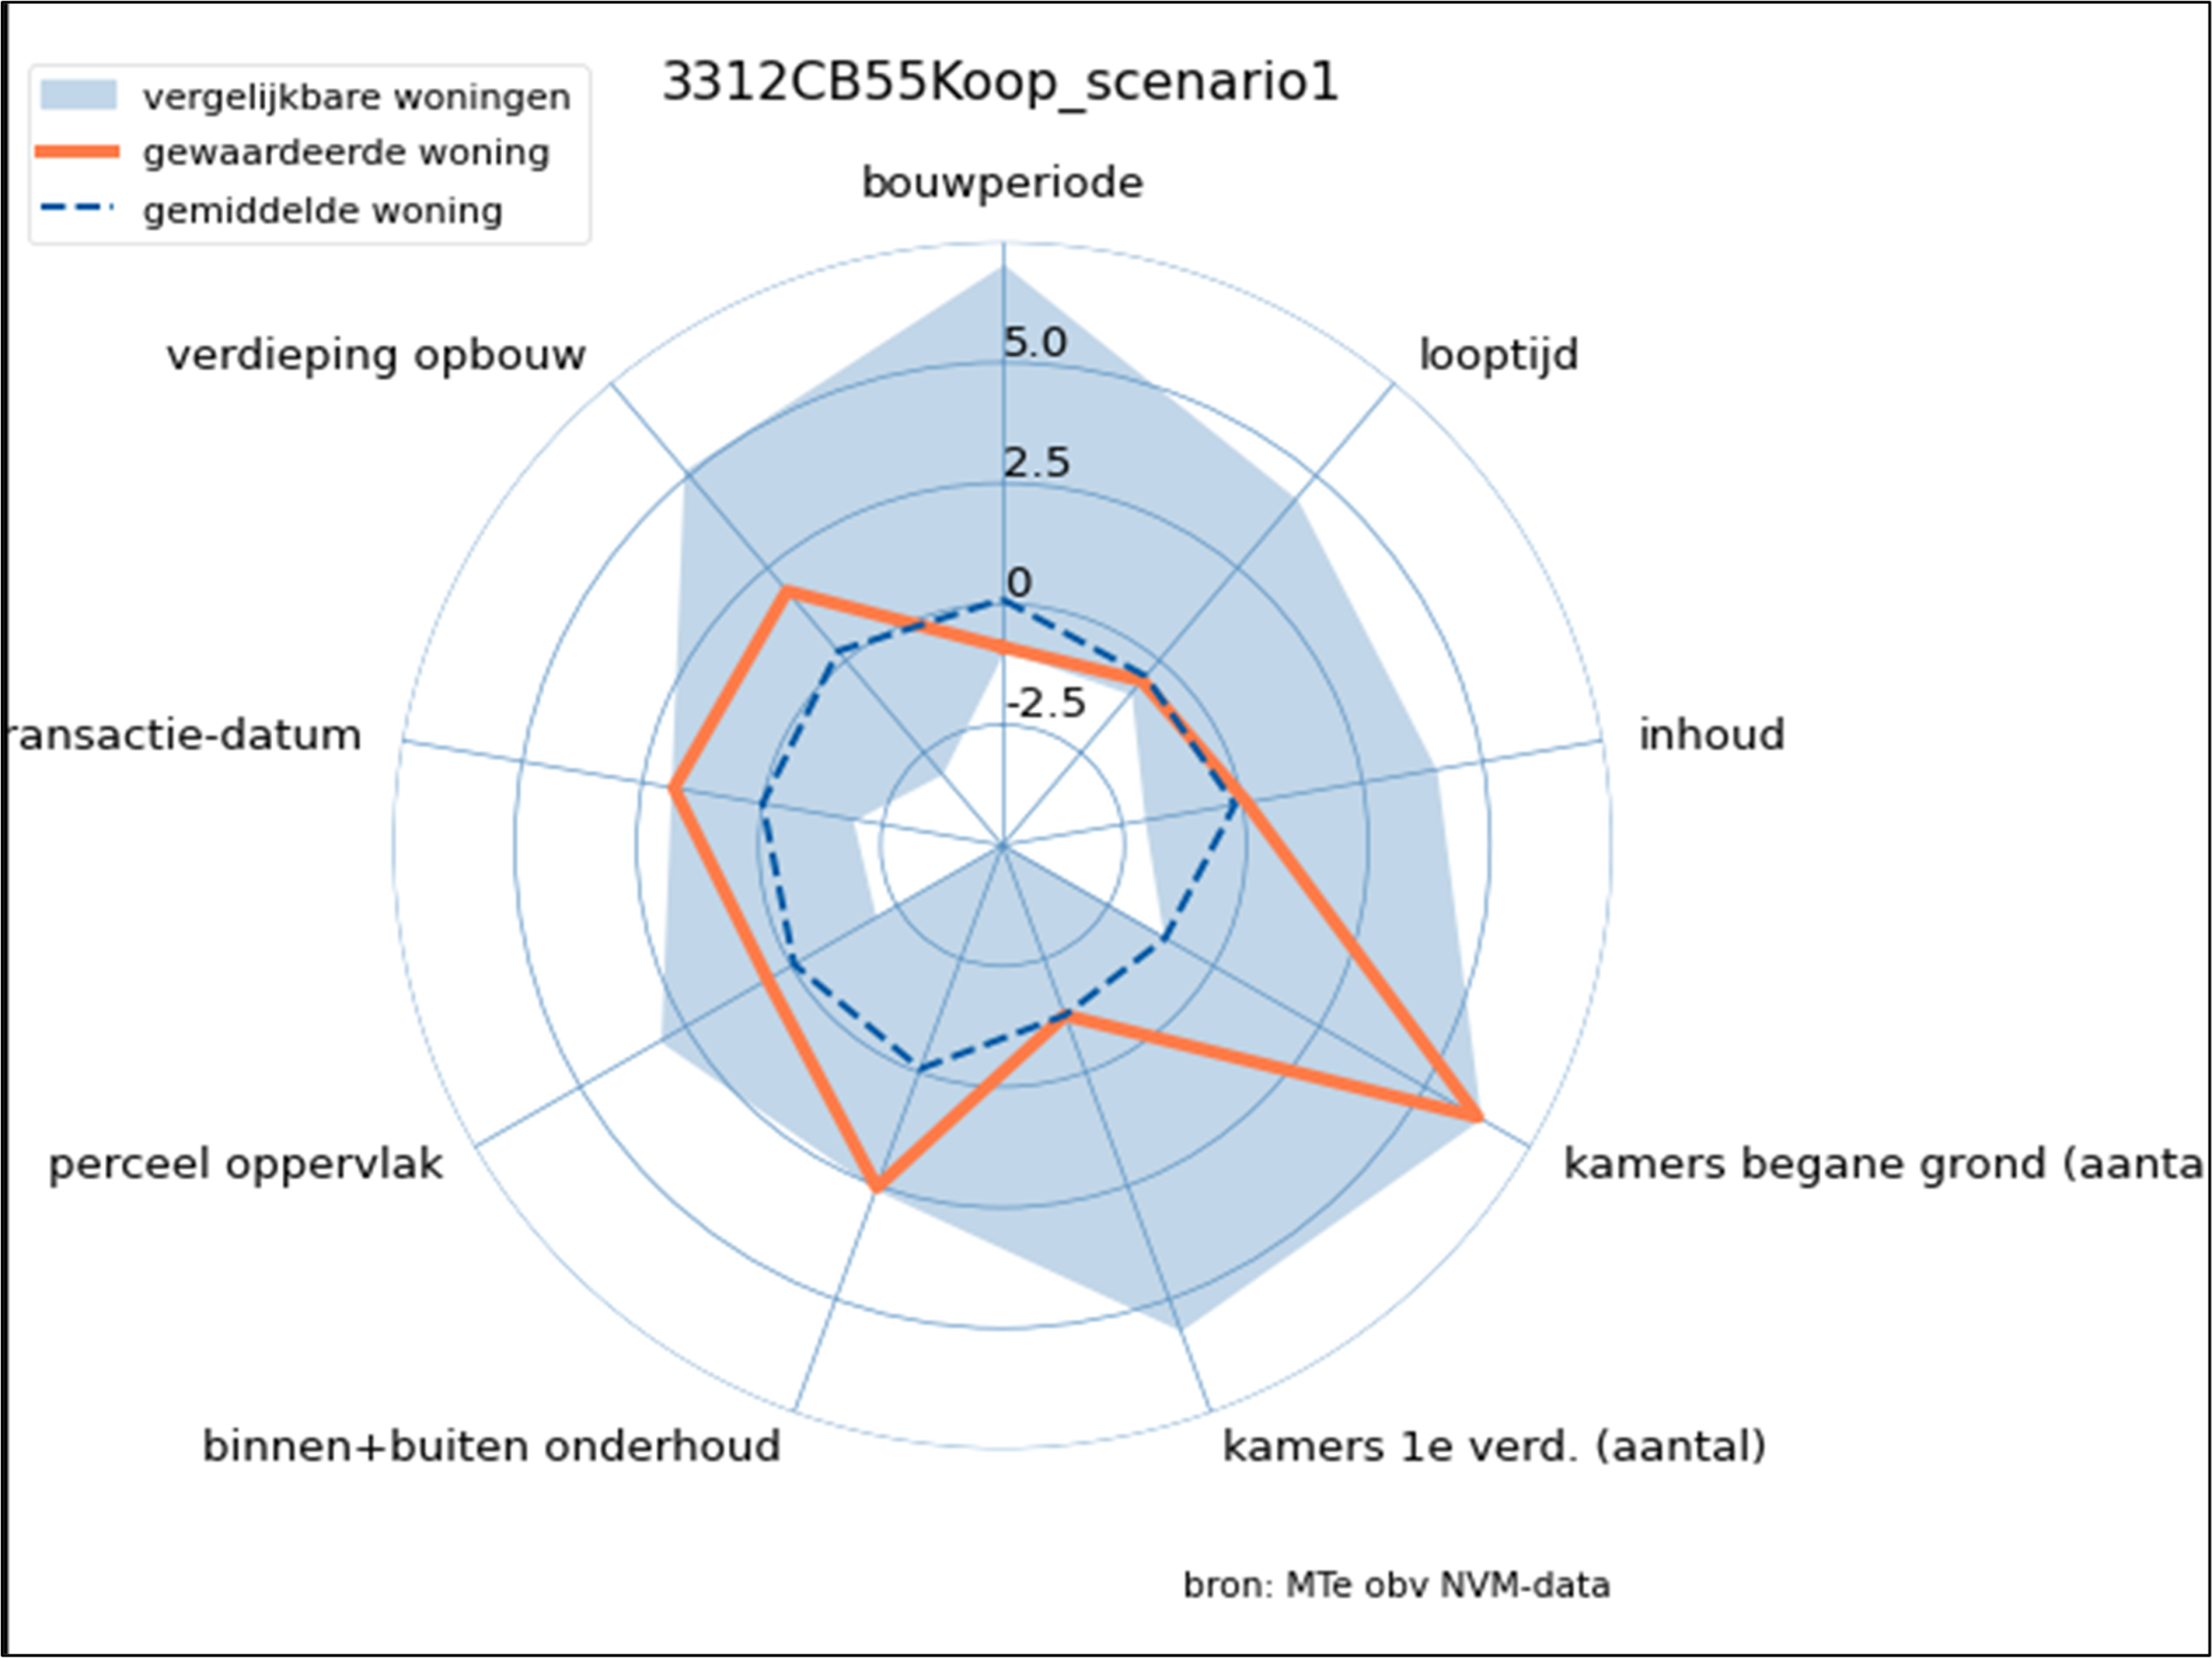
Momentum Technologies provides insight into all comparable sales used. Tables and a rose diagram are used for this purpose. The diagram provides insight into how the characteristics of the property to be valued relate to the characteristics of the reference sales. The general comparability of a reference sale is represented by a report mark on a scale of 1 to 10 (highest).

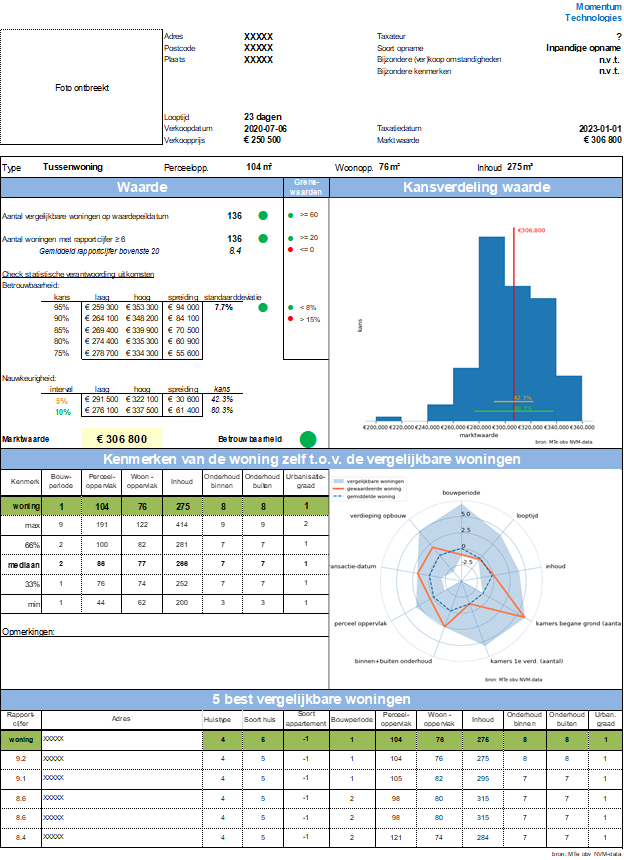
Summarized in the Scorecard

Detailed information for each rating is summarized in a scorecard.

Solving foundation risk


The Netherlands has approximately 425,000 residential properties with expected moderate to very serious foundation damage. This number is likely to increase as foundation issues become more widely known and more research is conducted on the subject.

There are many causes for this problem. It is usually impossible to identify the exact causes. Rather, there is a multi-causality, in which a number of factors play a role simultaneously and interactively. Consider, for example: pile rot, negative adhesion, and settlement problems with foundations on nothing more than a layer of sand on top of peat.

The problems occur in both urban and non-urban areas. (Zie ook De olifant onder de kamer)

Solution per residential property

Possible solutions include:

  • Jacking and stabilizing
    This involves carefully raising the building back to its original position.
  • New foundation piles
    Additional load-bearing capacity is created by placing new piles beneath the existing foundation.
  • Complete foundation renewal
    Removing and replacing the old foundation.

The costs involved are considerable and can be made slightly more bearable by also investing in energy efficiency and/or extra living space. The question then remains whether this is financially feasible for owners. (Zie ook “Funderingsherstel de mogelijkheden vanuit een investeringsperspectief”)

Solution at neighborhood level

When dealing with a neighborhood facing foundation problems, urban renewal may be considered. Depending on the possibility of densification, a case can be made for a complete renewal of the neighborhood whereby:

  • Owners receive a new home in exchange for their current home
  • Owners are compensated for the disadvantages of densification
  • New homes are built
  • Investors can achieve a return in line with market rates

In this case, the foundation problems could help alleviate the severe housing shortage. (Zie ook “Funderingsherstel de mogelijkheden vanuit een investeringsperspectief”)

Valuating a housing portfolio

Quick insight into the value of a residential portfolio

Based on the characteristics of a property, Momentum Technologies can calculate the probability distribution of its market value. By doing this for every property in the portfolio, the probability distribution of the portfolio’s value becomes clear.

By performing this calculation for multiple valuation dates, the value development of the housing portfolio can be determined.

Based on the median market value per valuation date, the year-on-year development becomes clear.

Foundation risk: “Getting a handle on uncertainty”

Any investment in real estate is uncertain. The current value cannot be determined with certainty. The same is true of the value after improvements to real estate. There are costs associated with improvements and the question is do the returns outweigh them? Point estimates of value can easily give too positive or too negative a picture. By generating a probability distribution for each estimated value, the risk of disappointing returns can be taken into account when deciding on that investment. This is illustrated below using a concrete example of foundation problems. The area at risk is a 19th century neighborhood in the center of Rotterdam: Het Oude Noorden. The choice is between eliminating the risk by means of a structural improvement of the foundation of the present house or demolish the old one and built a new at the some lot. Some 1 million houses is at risk and the owner is confronted with a smaller or a bigger problem, he might not be able to solve himself.

“Woon Amsterdam”

“Woon Amsterdam” annual report on the housing market since 2006

Woon Amsterdam” has been published every November since 2006. It offers an overall picture of the state and development of the Amsterdam housing market. The report is the result of cooperation between the Amsterdam Real Estate Association (MVA), the Amsterdam Federation of Housing Corporations and the City of Amsterdam. Since 2010, the report is also available online at the MVA site.

In 2017, in addition to the market figures for the City, figures became available for the entire Amsterdam Metropolitan Region. Furthermore, from that year, figures are available on the level and development of market values in the metropolitan municipalities, the City of Amsterdam and the city districts. Momentum Technologies, in close cooperation with the MVA, provides figures on the supply, sales and market values of homes for sale throughout the Amsterdam Metropolitan Area.

Homelocator

For a better understanding of housing opportunities within the Metropolitan Area, an application was created in 2019 that allows every house seeker to determine, from one or more locations (workplace, school address, etc), an associated mode of transportation (bicycle, public transportation, car) and a maximum travel time, the area where the house might be located. The application then provides a picture of the market values for the parts of this area for a housing type of choice. The user can further narrow down the area by limiting the price range. For each area of interest, the user can zoom in and will then also see the houses for sale. Detailed information for each property is then avalaible.

Key figures 2019:Woon